
I know Python, but how do I analyze a big dataset?
“I’m trying to analyze a big, messy dataset for the first time, and it’s going okay. But, I’m a web developer - not a data scientist. I’m guessing there’s a better way to go about it… any tips?”
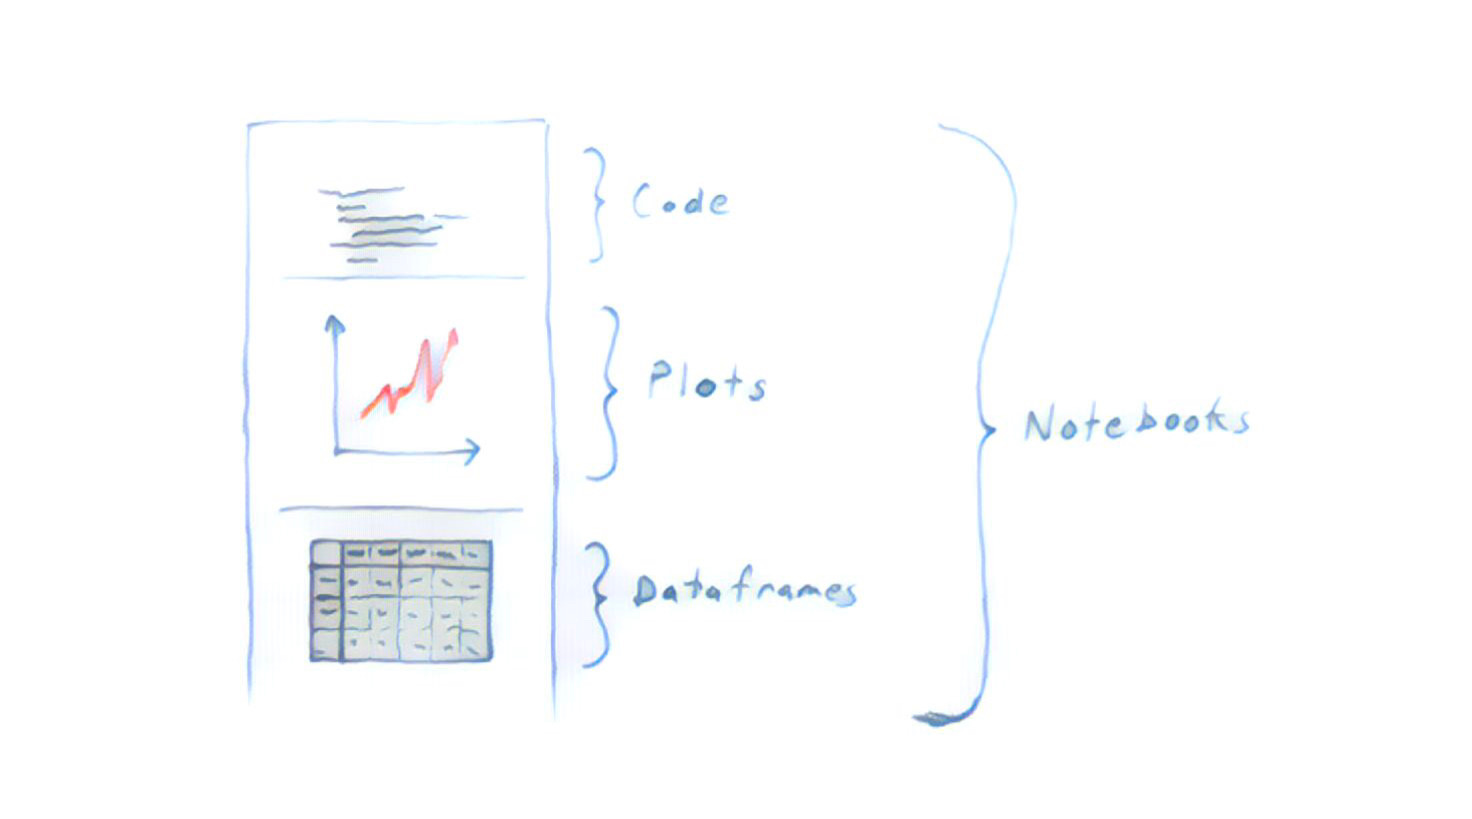
Sure! While you might get through the task with the tools you already know, the wide world of Python data science is here to help you. But, before you dive into specific tutorials, books, and courses, let me sketch the big picture by explaining the three tools you’ll use in every data analysis.
Plots
Exploration, debugging, and checking correctness all involve constantly printing and plotting things. The more this becomes second nature to you, the better you’ll be at asking and answering questions of your data (and catching mistakes).
A great library for plotting in Python: Matplotlib.
Notebooks
You'll often want to refer to prior results - things you've plotted and printed. Working in a terminal, text editor, or traditional IDE makes this difficult. Plots either disappear or stack up in a mess, and are always detached from the code that created them. Notebooks solve these problems, making it easy to explore without fear of losing prior results.
The first and most popular notebook for Python: Jupyter.
Dataframes
Lists and dictionaries are slow (and conceptually awkward) when it comes to data analysis. What you really want is a spreadsheet, a table. Something with rows and columns you can refer to and manipulate easily. In the world of Python data science, this is called a “dataframe”. Your first step in almost any analysis is to get your data into a dataframe (or perhaps several), at which point you have a huge set of tools available.
The undisputed king of Python data analysis libraries: Pandas.
Additional Q&A
How should I download these libraries? You can download these libraries individually using their instructions, or download these and many other useful libraries all at once in the Anaconda distribution.
Do I need to connect to a database? Not that I’ve ever heard. You just download the data you need as a file, from whatever source - database or otherwise. Usually, that takes the form of a csv or something. Then you load that data into memory as a dataframe, and go from there.
Should I save my results as I go? Usually, you do most of your work in memory, and only save new files to disk when you’ve performed a lengthy, expensive operation you really don’t want to do again. Often, an analysis will just start by downloading the raw data, doing a bunch of things to it, and saving a few things to disk at the very end.
How do I make my code faster? Snakeviz is great for discovering bottlenecks. Also, as a general rule, it’s best to do as much as possible with Pandas itself. It’s much more efficient than Python’s lists, dictionaries, and loops. You may eventually also want to try Numba, which can compile certain Python functions to ultra-fast machine code.
What if I have a lot of data? Depends how much. Pandas can handle much more than Excel. It’s only limited by how much data can fit in your machine’s memory. Here are some recommendations for scaling to large datasets. Also, though it’s perhaps more trouble than it’s worth, you can rent machines in the cloud for ~$10/hour that have more than a terabyte of memory (see this list).